Topology Optimization
Basic loading simulation
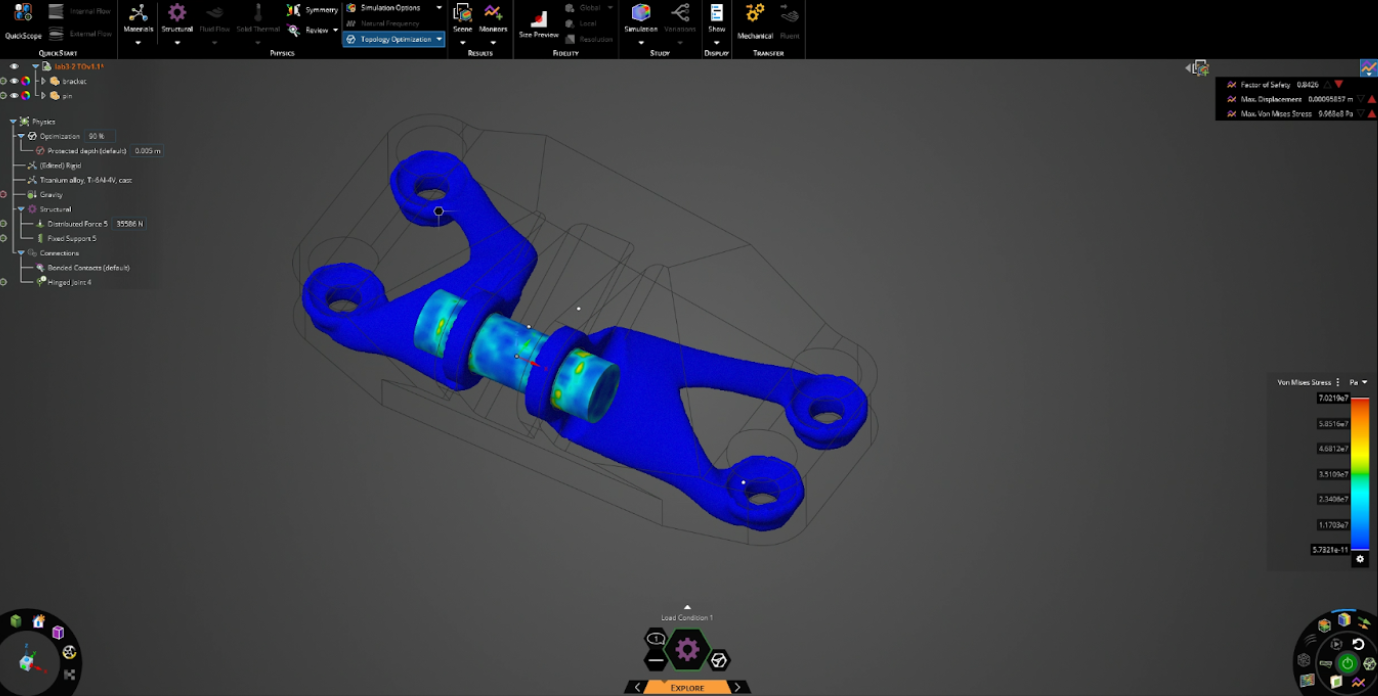
Topology optimization validation simulation
Observations while considering manufacturing for use on 3D printers
The simplest thing to notice is that the overall volume of the cantilever will decrease in the optimized form. This directly reduces material costs, energy costs, and the print speed of each layer since the average volume per layer is decreased.
However, if we are using a PLA printer, the interlayer time will not change. There may be a small reduction in the length of the print axis due to the optimization, but close to, if not the same number of layers will be needed. As with the overall print time calculations, the orientation of the cantilever will still have the most significant impact on the total print time. Any reductions in laser-resin interaction times due to the reduced cantilever volume will be insignificant as compared to the in-between layer time that dominates when the longest dimension of the cantilever is along the print axis.
Another factor to consider is the need for support material now that the body of the cantilever is not solid. This will not significantly increase an added amount of laser-resin interaction time, but it will cut into the amount of material saved with the optimized topology.
Part 02
The sweet spot for FOS> 1.00 seems to be around the 84%
don’t see any discrepancies, the change from the base part to the topology optimized part seems straightforward. The reduction in cost is a near 40% reduction from the original.
I identified 3 design changes me can make to potentially further improve the volume reduction:
Lattice topology optimization: The benefit of this method would allow for material to be deposited in the absolute necessary location. The lattice allows for a network connection of nodes working to equalize the forces and the ability to remove material where a node connection is not located. In theory, this method allows for reduced material deposition when using additive manufacturing technologies.
Change of material: Using a stronger material would enable the Topology Optimization procedure in ANSYS to remove more material, increasing the volume reduction.
Use AM and not completely fill parts: In the areas of the bracket that are currently solid, volume reductions could be made by taking advantage of AM capabilities to print those isolated sections with lattice type fill/
All loads, 90% reduction Factor of safety: 0.84
Load condition 3 - Factor of safety = 0.90
Load condition 1- Factor of safety = 1.414
Load condition 2 - Factor of safety = 2.2146
Load condition 3 - Factor of safety = 3.0161
Load condition 4 - Factor of safety = 2.9496
Load condition 1 - Factor of safety = 1.05
Load condition 2 - Factor of safety = 2.91
Load condition 4 - Factor of safety = 4.45
All loads, 75% reduction Factor of safety: 2.08
Load Analysis
Note: Most of our FDM baseline tip displacements were under .1 in, but none were for the SLS printed cantilevers. This makes sense given the greater stiffness of the FDM beams.
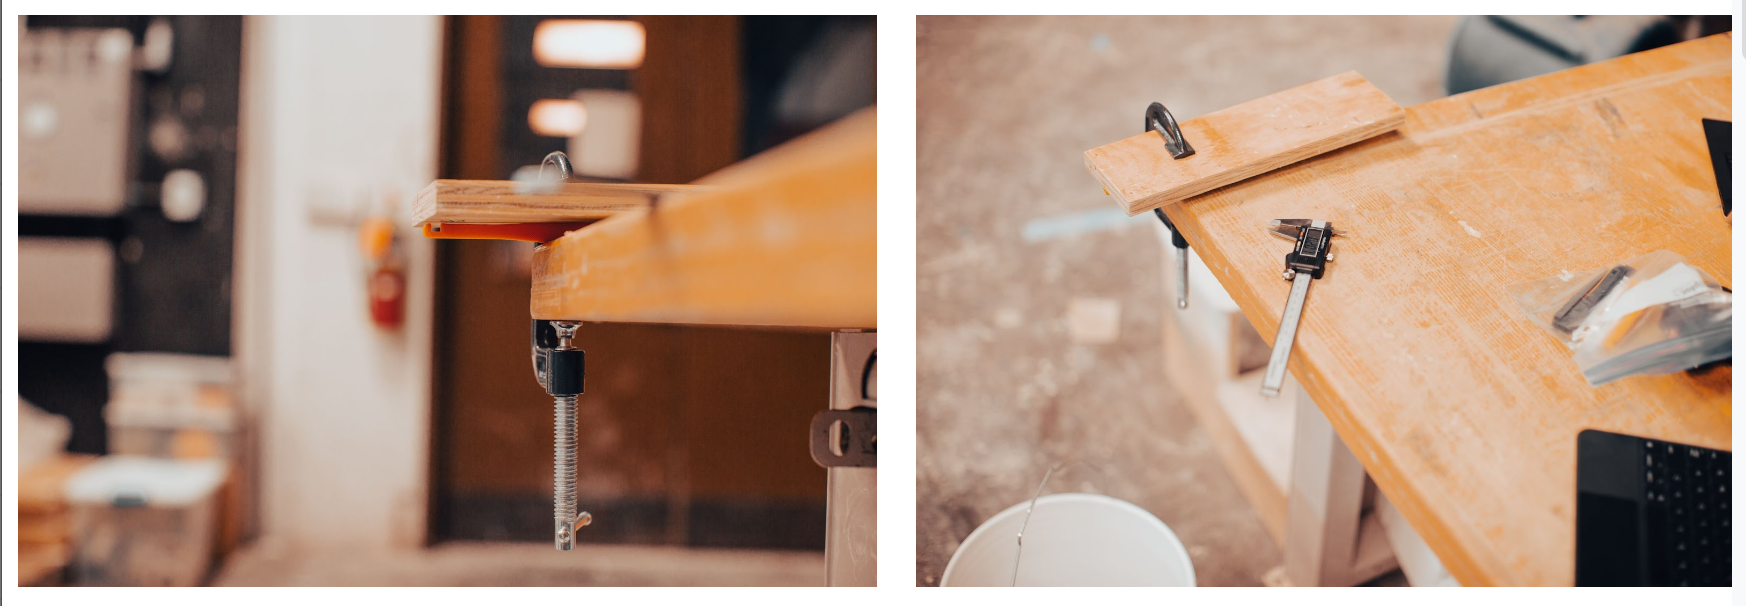
using FE analysis I calculated a max displacement at the tip of the cantilever to be .00143 meters (.056 inches), based on a 20 newton force. All of our measurements for initial tip displacement were well above this theoretical .056 inch calculation. There are many reasons that could contribute to this difference:
A 20 newton force is slightly less than the 5 lbs we had hanging on the cantilever.
The simulation assumes a perfect rigid support. Our wood blocks are not completely rigid.
The weight of our bucket weight was determined by the initial empty weight and a measured volume of water. Without precise instruments it is likely that our 5 lb starting weight was not exact.
Any issues during the printing process that created voids, misaligned fibers, poor adhesion etc…that would reduce the strength of the cantilever and increase deflection for a given load.
As the cantilevers begin to displace more and more, the orientation of the force vector changes with respect to the flat notch on the tip; this was not captured by ANSYS. As this vector is always perpendicular to the ground (due to gravity), when the cantilever bends, the weight is distributed more efficiently throughout the material, enabling it to hold more.
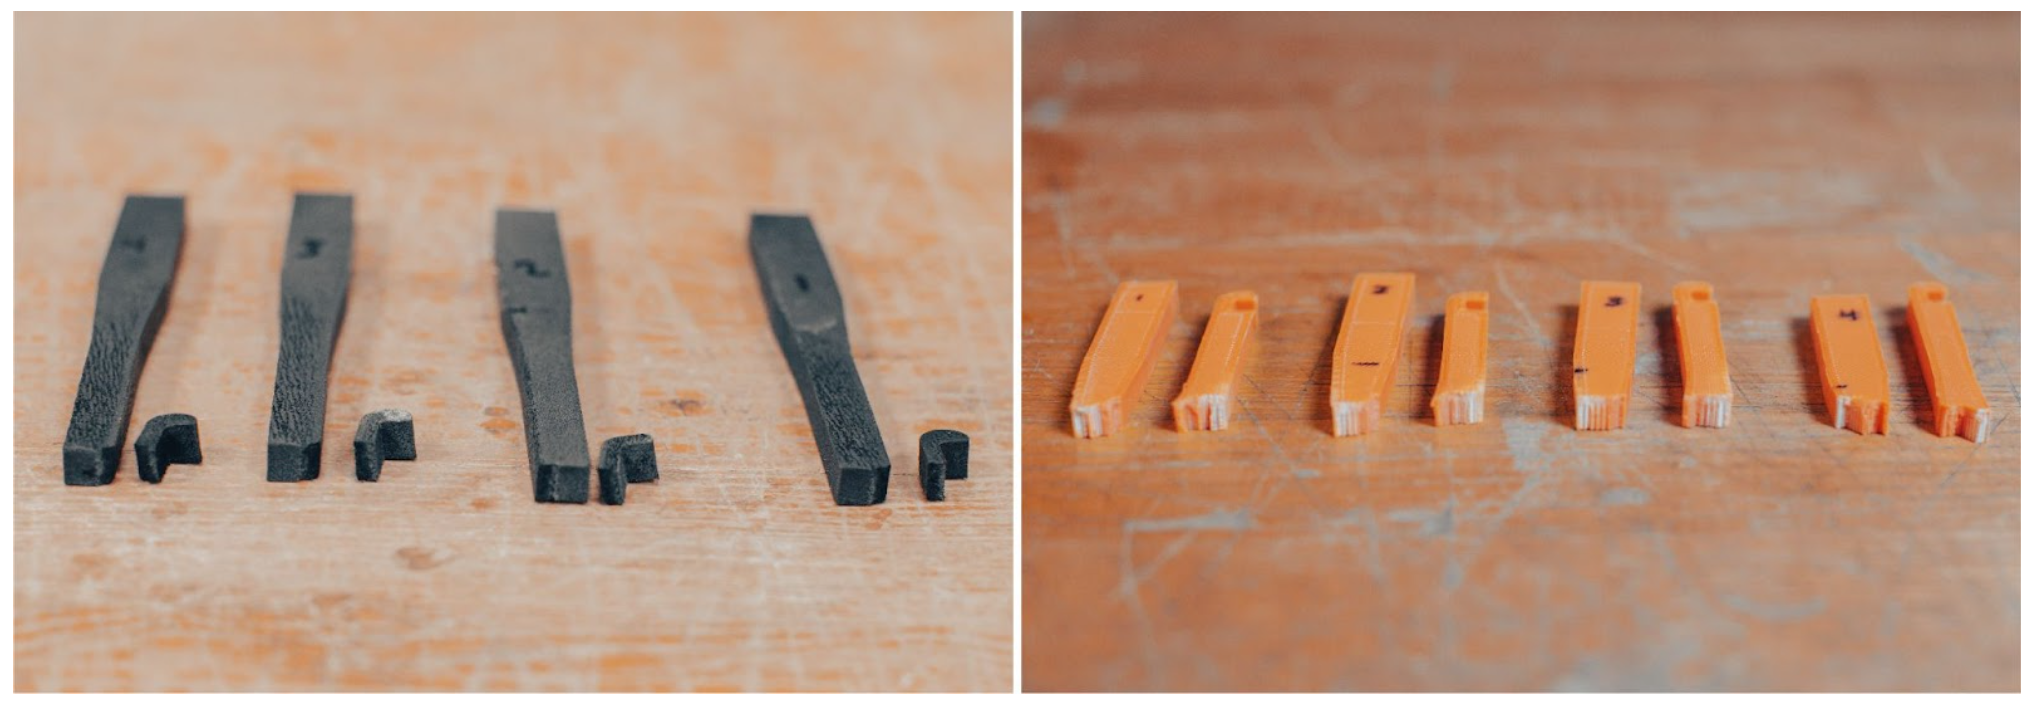
Left: SLS failures, Right: FDM failures
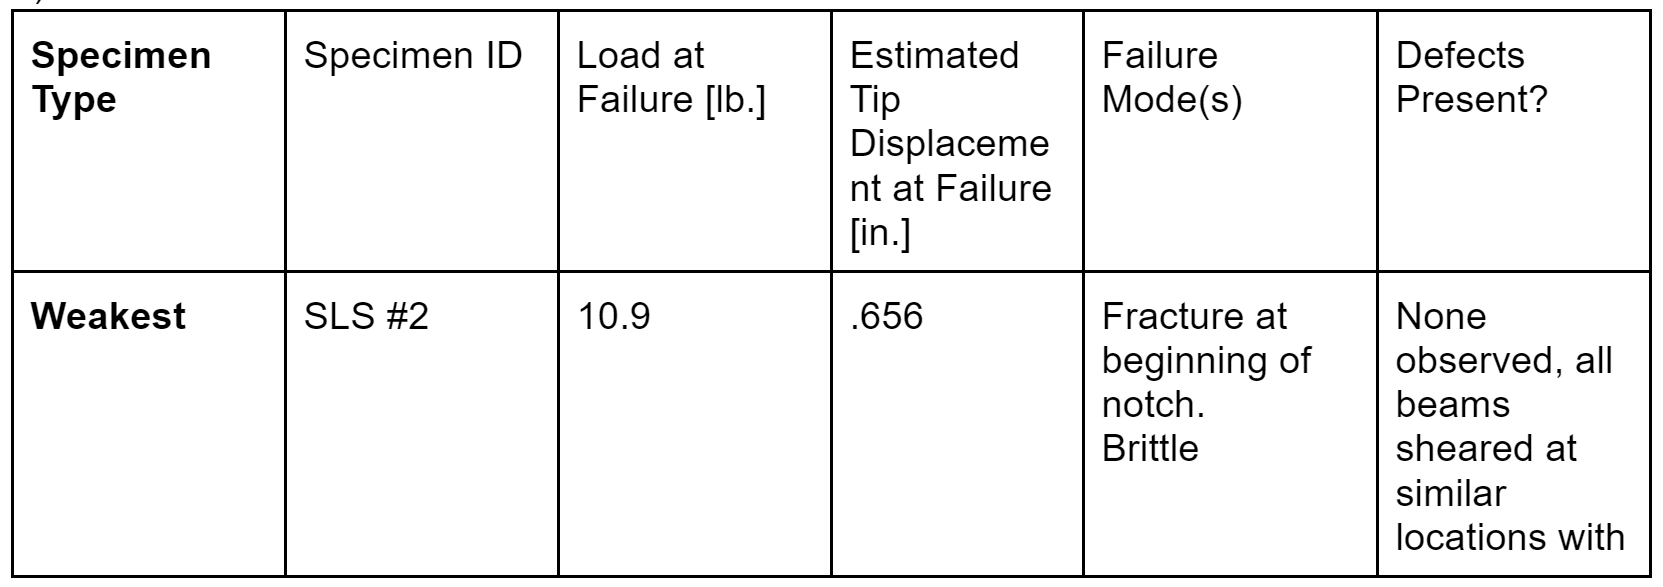
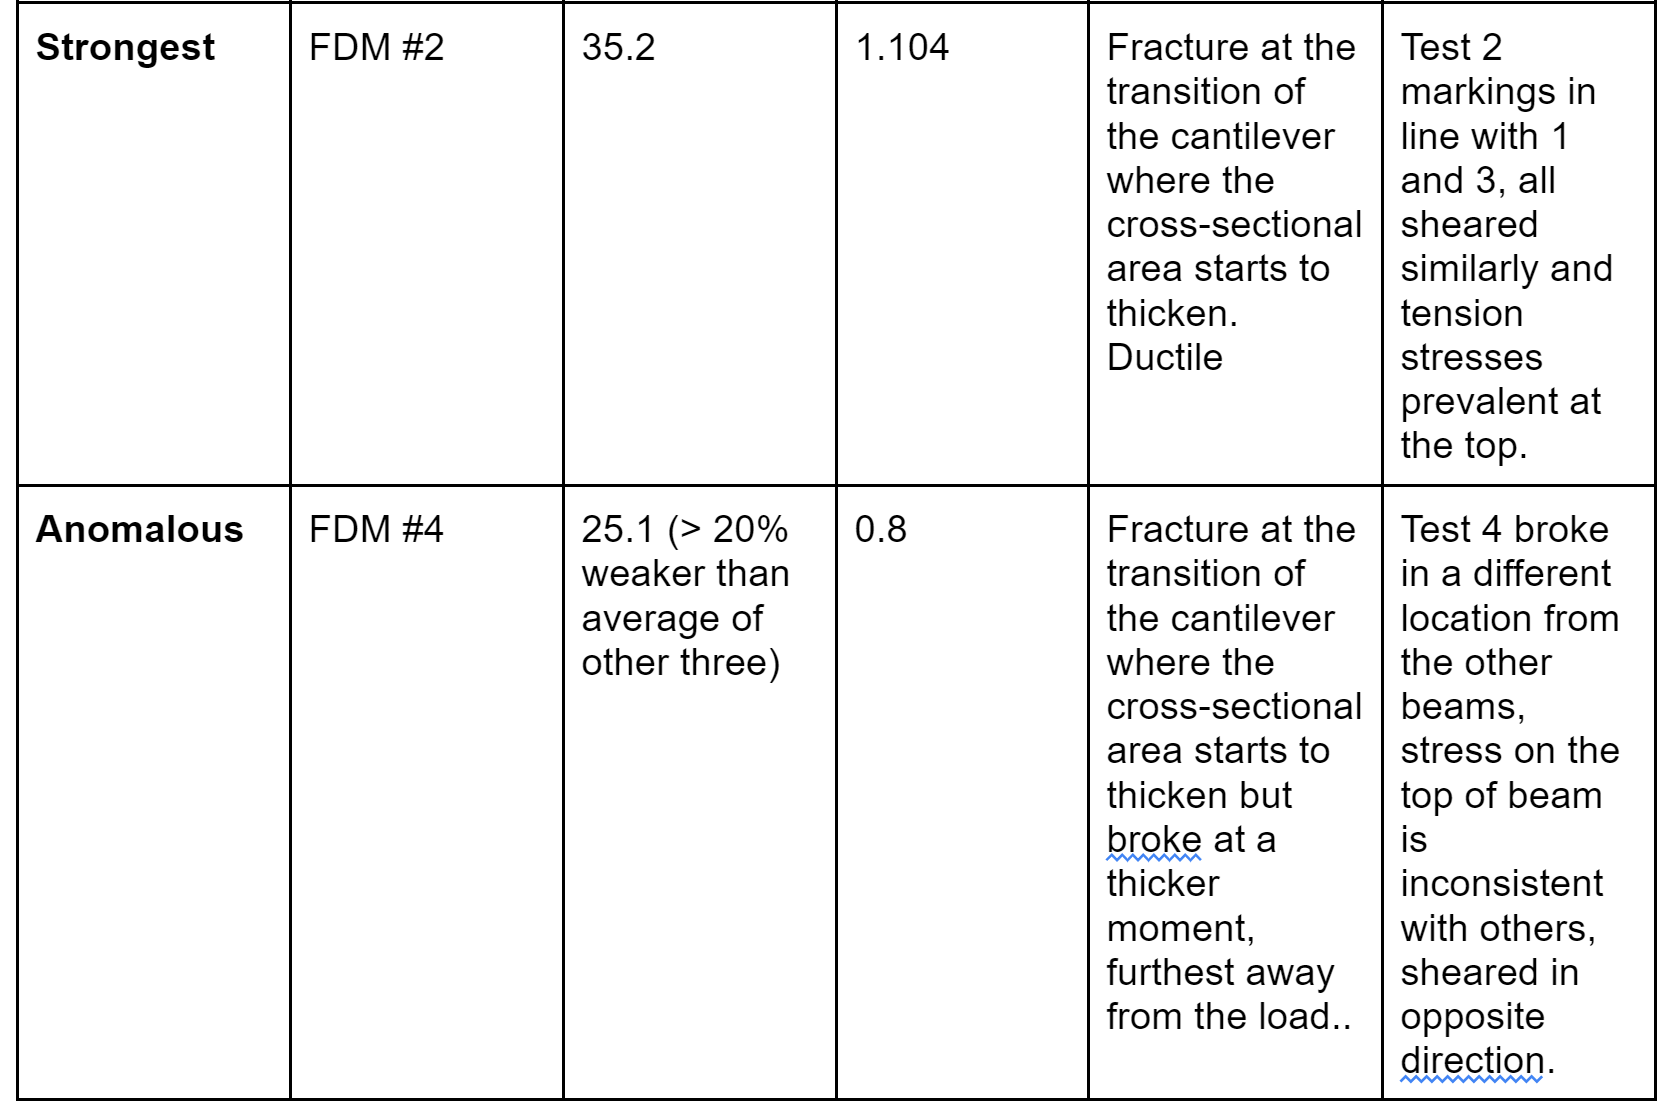
When structural integrity is the driving force, the FDM printed beams were the stronger option. The FDM beams handled loads and provided factors of safety nearly double that of the SLS beams. However, these are not direct comparisons as the mode of failure for the beams was not the same. The SLS beams all failed at their thinnest point in the “notch” while the FDM printed beams failed closer to their thickest cross sectional area. This leaves the possibility that with a slightly larger minimum thickness to strengthen the “notch” section, the SLS beams could withstand a larger load with failure at a thicker section of the beam. (However, searching for comparisons between PA 12 and 1.75 mm PLA feedstock reveals the PLA to generally have larger tensile strength and tensile modulus (HP Development Company) (“RS PRO 1.75mm Black PLA 3D Printer Filament, 1kg”).)
The PLA spool for the FDM is significantly cheaper than the powder for SLS stock material. In addition, the time required to print a FDM beam is less than that for SLS - To print one cantilever on the Ender 3, assuming no changes to print parameters, it takes ~ 180 minutes, whereas the SLS takes nearly that much time just in prep and cool down. So for the purposes of making quick iterations of design changes in small batches, FDM makes the most sense. If the number of cantilevers per batch were increased, there will be a point where the speed of printing with the laser in SLS can overcome the lengthy time required in prep and post-processing, to make the method more advantageous.
Computer Vision 3D Print Monitoring
Print File: cantilever_75deg.gcode
Filament Color: Clear
Lighting: Ring light from above
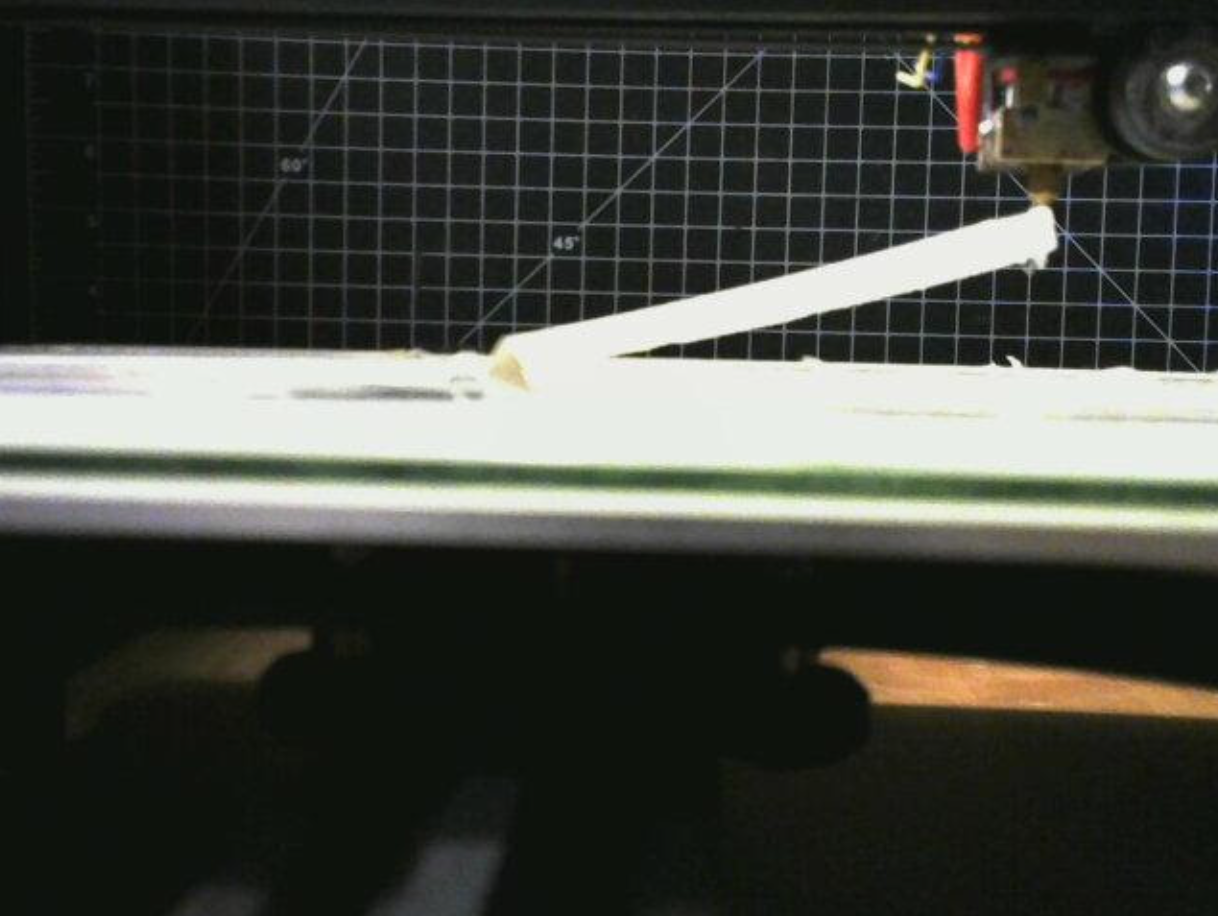
Observations: I was quite surprised that the print came out as clean as it did considering the overhang. While the printed cantilever is not accurate to the digital file there was no spaghetti.
The webcam does not work well with the chosen filament. As depicted below: the clear transparent filament looks almost white. Even while adjusting the light exposure the printed object seemed to be too high of an exposure to the rest of the scene captured.
Since there were no failures in this print I could not test the delay of TSDs analysis but from observing the real-time and the live-stream happening in Google Chrome, there was a one second delay in the recording.
Print File: cantilever_75deg.gcode
Filament Color: Marble
Lighting: Diffused fluorescent bulb light from the side
Observations: Again the print did not fail, and this time there were technical issues with the network disconnecting. This proved to be no issue for the print, but if one were running a timelapse there would be interruption. The delay seemed to be better after the network came back online and the delay was not distinguishable.
Final Lab5_cantilever_75deg print - Side by side comparisons
Print File: cantilever_0deg.gcode
Filament Color: Marble
Lighting: Diffused fluorescent bulb light from the side
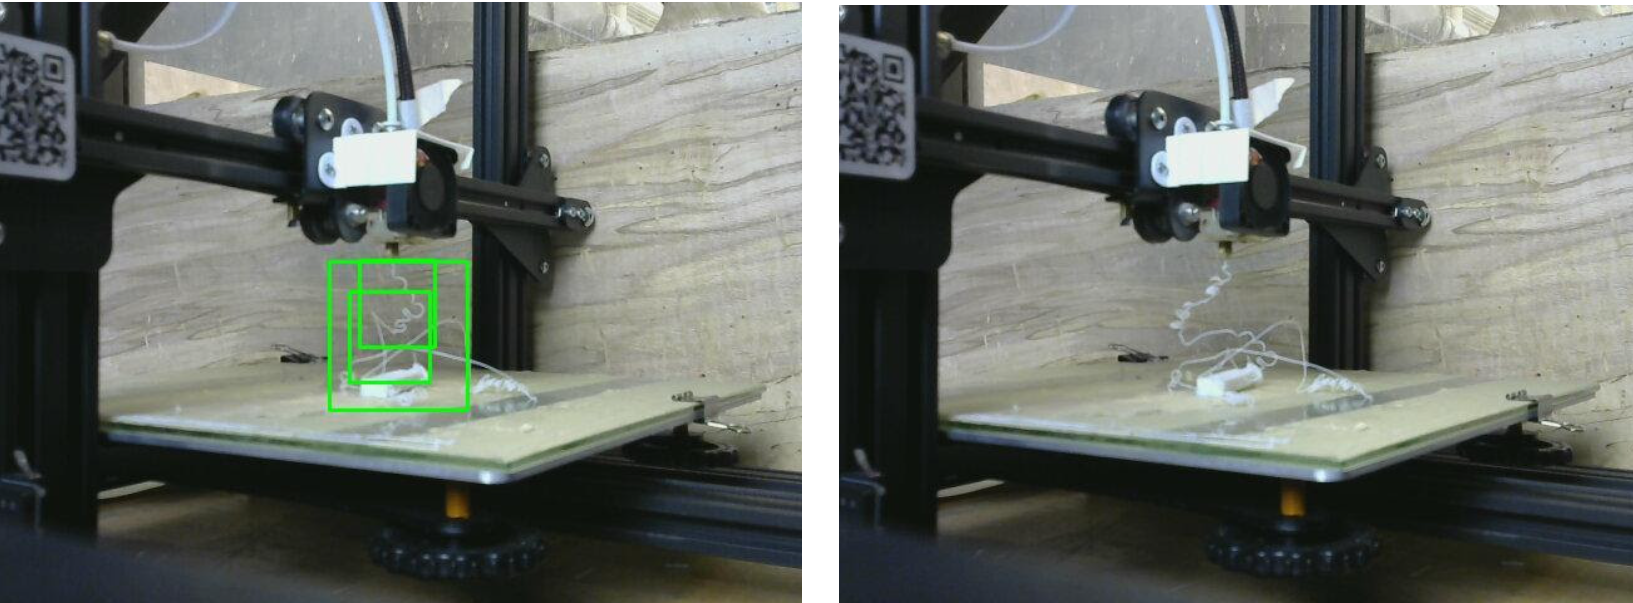
Observations: The print failed near the halfway point. After analyzing the g-code, it appears the failure was due to a location where the extruder head did not move but continued to extrude filament. The time for TSD to identify the problem from when it actually happened was about 12 minutes. The blob that extruded was stuck to the nozzle giving the spaghetti detector the perception that the print was still progressing as desired. Once the blob dislodged the estimated time TSD took to identify the failure was approximately 2 minutes. TSD found that it may not be a problem right away but as the spaghetti grew the program stopped the print and notified me that it was a failure.


